- August 28, 2024
- Posted by: Sudharchanan Sriram Manickavel
- Categories: AI/ML, Data Analytics, Data Visualization, Large Language Models, Predictive Analysis, Python library, Snowflake, Streamlit
Introduction

Thig blog details a Snowflake and Streamlit-powered Airline dashboard, designed to provide comprehensive insights into critical aspects of airline operations and customer experience. The dashboard offers a rich set of features, including customer satisfaction analysis, passenger preferences, ratings, and feedback, as well as advanced forecasting for passenger volumes and price trends.
With a focus on customer satisfaction, the dashboard provides granular insights into passenger preferences, ratings, and feedback, empowering airlines to better understand the voice of their customers. Additionally, it provides in-depth analysis of flight distribution across routes and predictive models for pricing, customer satisfaction, and sentiment detection. Price trend analysis further empowers airlines to optimize fare pricing dynamically, while predictive models provide forecasts on future pricing trends and customer satisfaction levels. It also offers passenger volume forecasting, enabling airlines to anticipate demand and adjust their strategies accordingly.
By effectively utilizing cutting-edge Snowflake Cortex functions and leveraging large language models (LLMs), this dashboard not only predicts sentiments from customer reviews but also offers powerful, data-driven categorization of reviews to help airlines optimize their services and improve the overall customer experience. Let’s explore the dashboard’s features in detail.
Understanding the dataset
The dataset utilized for building the Airline Customer Satisfaction and Price Prediction is sourced from Kaggle. It comprises 22 columns and 129,000 rows. The airline names are anonymized. Please refer to the data dictionary below for your reference.
- Gender: Gender of the passengers (Female, Male)
- Customer Type: The customer type (Loyal customer, disloyal customer)
- Age: The actual age of the passengers
- Type of Travel: Purpose of the flight of the passengers (Personal Travel, Business Travel)
- Class: Travel class in the plane of the passengers (Business, Eco, Eco Plus)
- Flight distance: The flight distance of this journey
- Inflight wifi service: Satisfaction level of the inflight wifi service (0: Not Applicable;1-5)
- Departure/Arrival time convenient: Satisfaction level of Departure/Arrival time convenient
- Ease of Online booking: Satisfaction level of online booking
- Gate location: Satisfaction level of Gate location
- Food and drink: Satisfaction level of Food and drink
- Online boarding: Satisfaction level of online boarding
- Seat comfort: Satisfaction level of Seat comfort
- Inflight entertainment: Satisfaction level of inflight entertainment
- On-board service: Satisfaction level of On-board service
- Leg room service: Satisfaction level of Leg room service
- Baggage handling: Satisfaction level of baggage handling
- Check-in service: Satisfaction level of Check-in service
- Inflight service: Satisfaction level of inflight service
- Cleanliness: Satisfaction level of Cleanliness
- Departure Delay in Minutes: Minutes delayed when departure
- Arrival Delay in Minutes: Minutes delayed when Arrival
- Satisfaction: Airline satisfaction level (Satisfaction, neutral or dissatisfaction)
Exploratory Data Analysis
Airline Customer Satisfaction Analysis
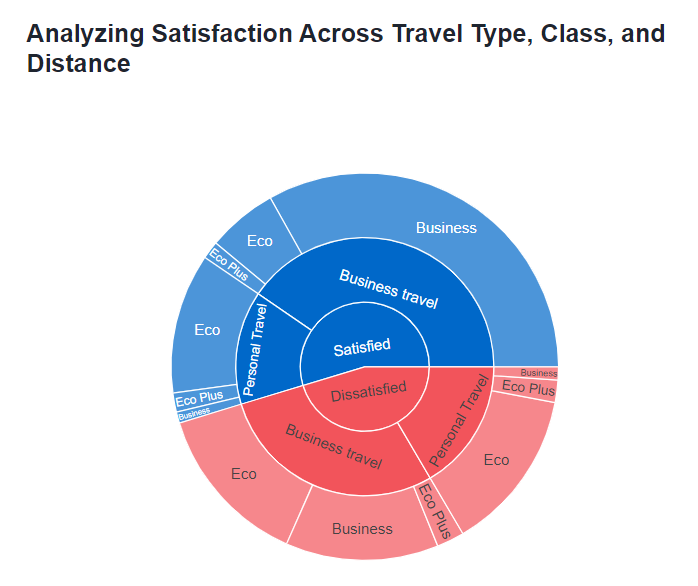
Analysing Satisfaction Across Travel Type, Class, and Distance
Using a sunburst chart, we visualize the distribution of customer satisfaction across different travel types, classes, and flight distances. This will help us understand how these factors impact overall satisfaction.
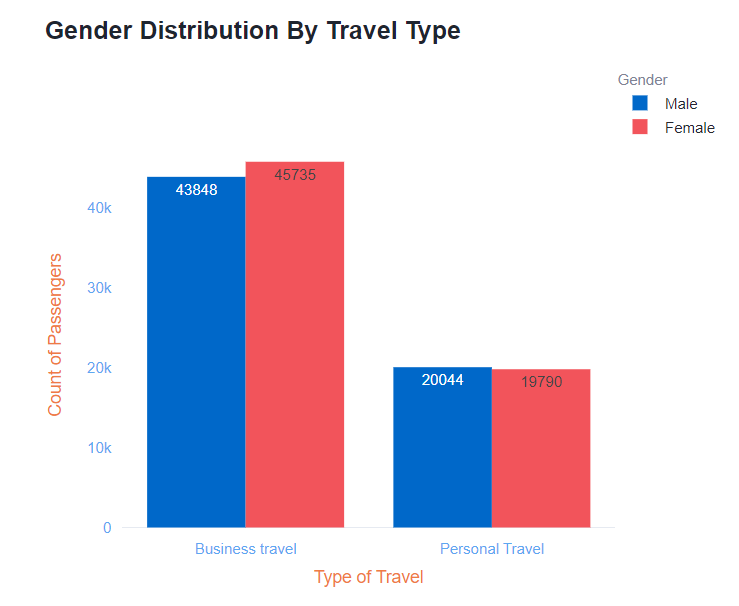
Gender Distribution by Travel Type
A grouped bar chart will illustrate the distribution of travel types by gender. This visualization will reveal gender-specific travel preferences and trends.
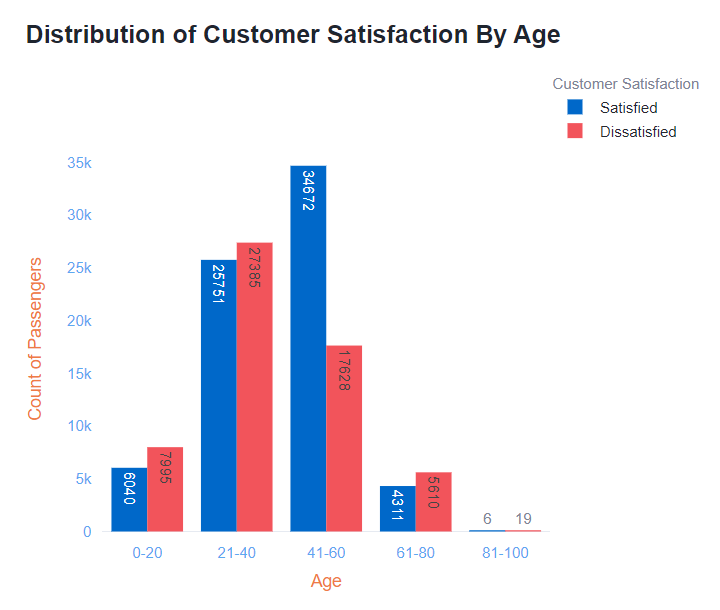
Distribution of Customer Satisfaction by Age
We will use a grouped bar chart to analyse customer satisfaction ratings across different age groups. This analysis will help us identify age-related satisfaction trends.
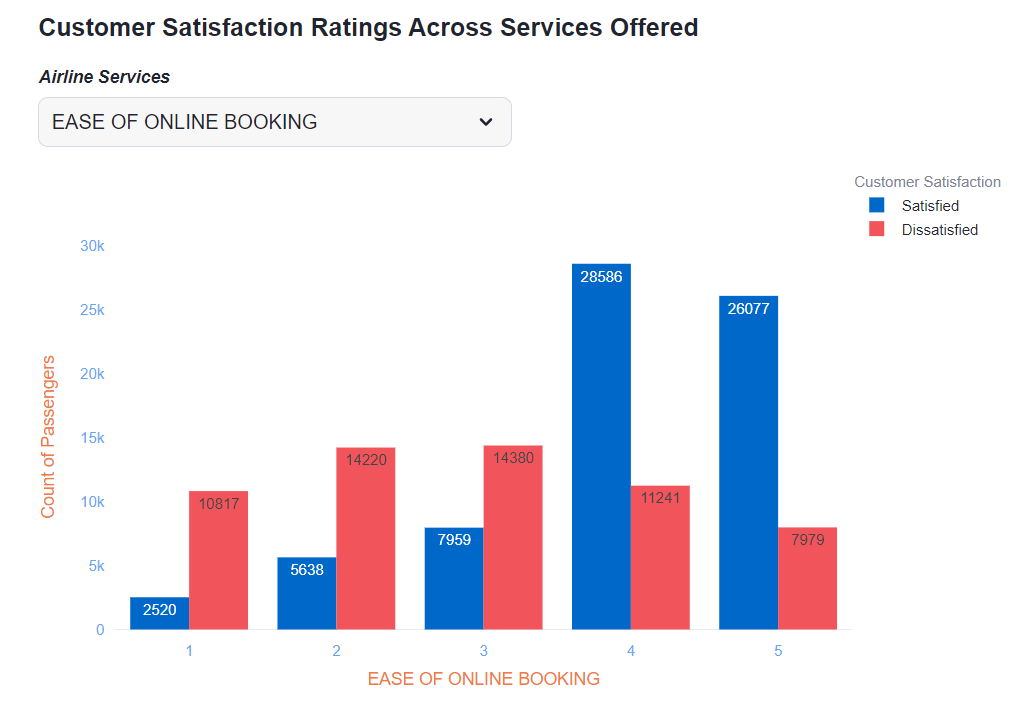
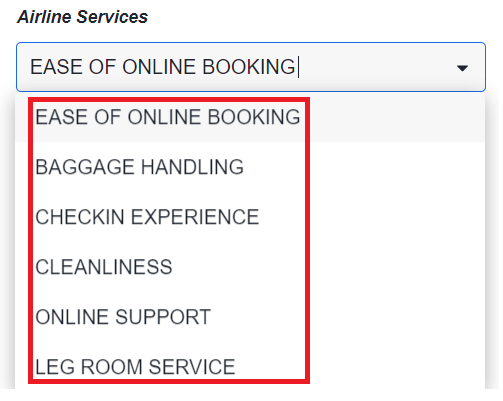
Customer Satisfaction Ratings Across Services Offered
This grouped bar chart will display satisfaction ratings across various airline services, such as seat comfort, food quality, inflight entertainment, and more. Users can select specific services from a dropdown list to compare customer satisfaction levels across services.
Analysis of Airlines and Flights
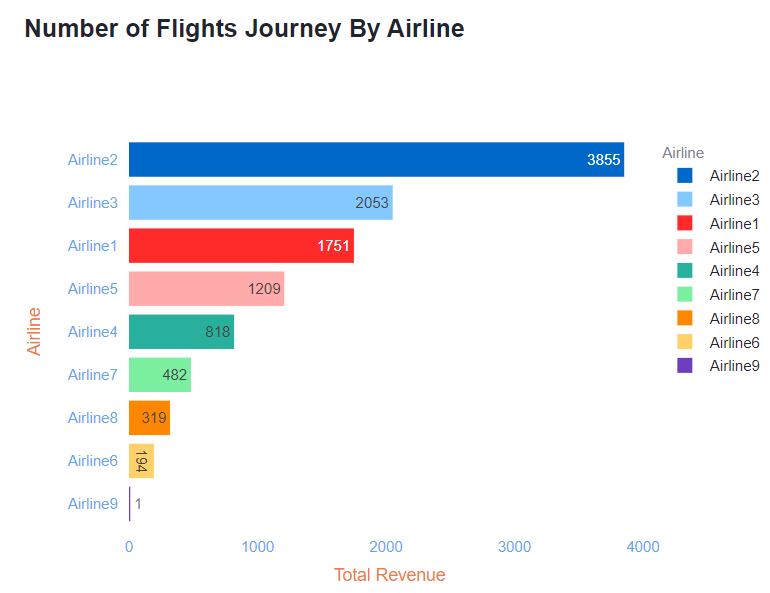
Number of Flights Journey by Airline
A bar chart will show the number of flights taken with each airline. This will provide insights into airline popularity and customer preferences.
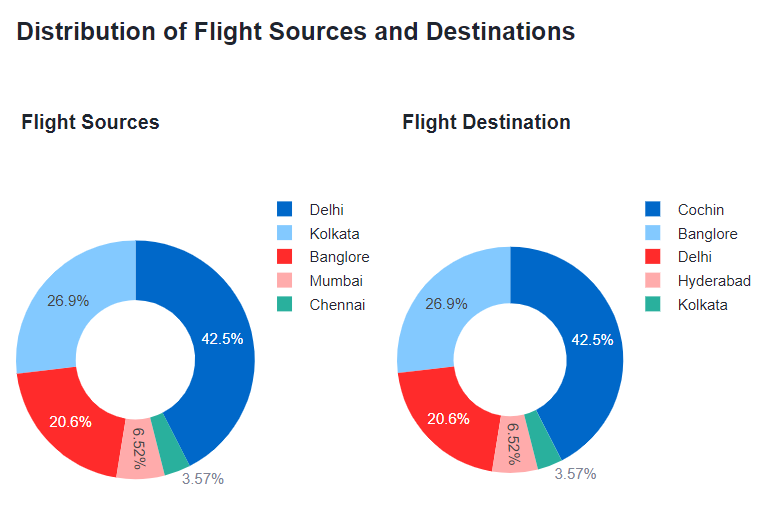
Distribution of Flight Sources and Destinations
Using a donut chart, we will visualize the distribution of flight sources and destinations. This will help us understand the most common routes and travel patterns.
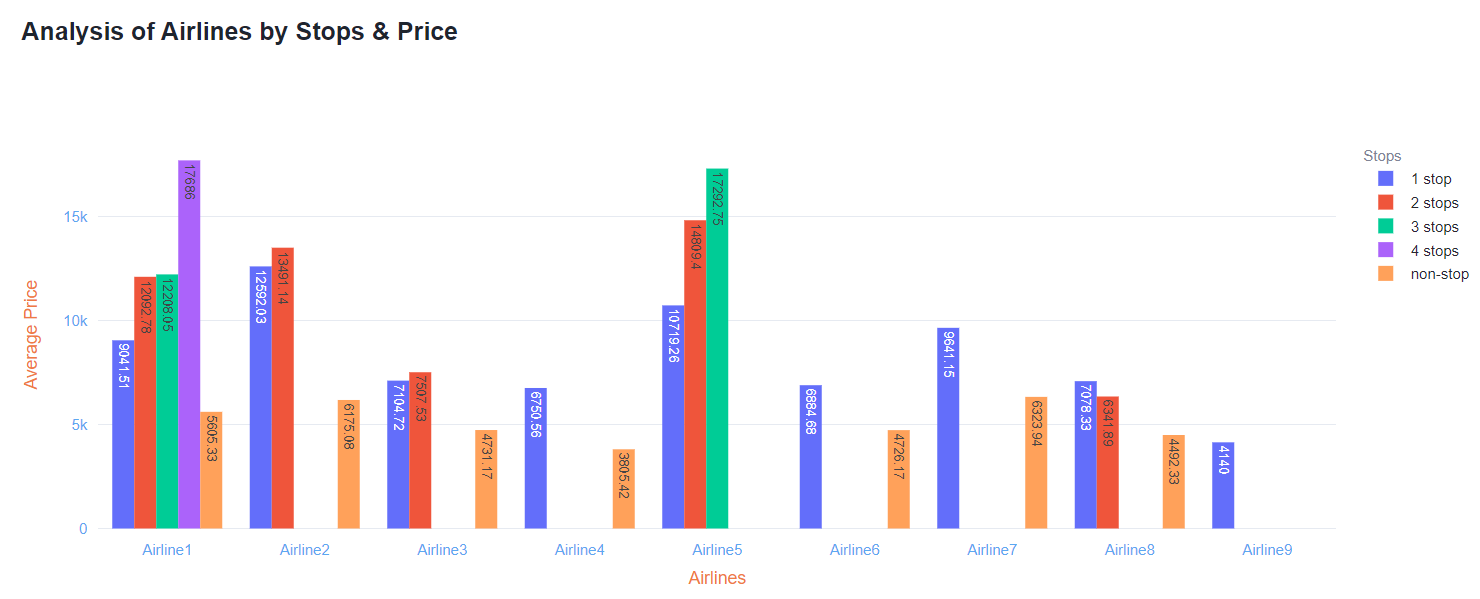
Analysis of Airlines by Stops & Price
A grouped bar chart will compare airlines based on the number of stops and ticket prices. This analysis will highlight the relationship between flight stops and pricing strategies.
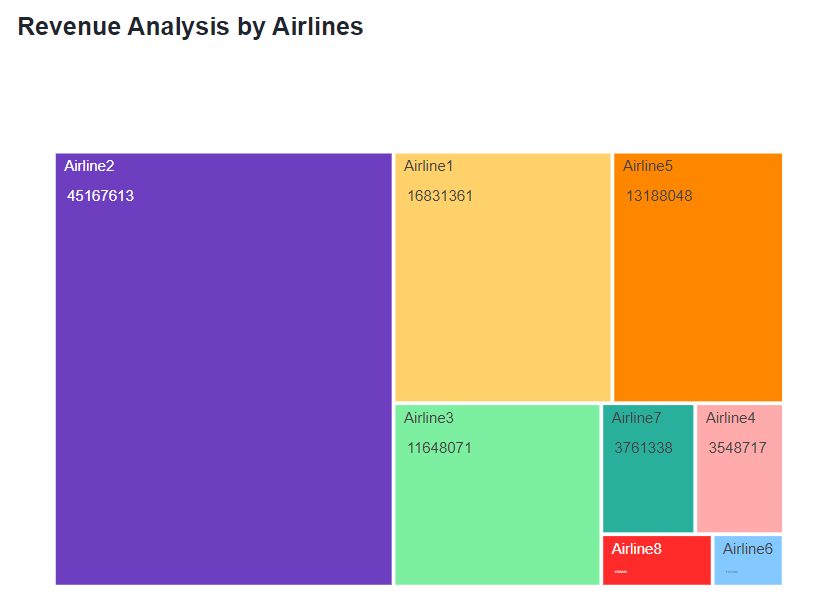
Revenue Analysis by Airlines
A treemap chart will visualize airline revenues, allowing us to identify the most profitable airlines. This chart will provide a hierarchical view of revenue distribution.
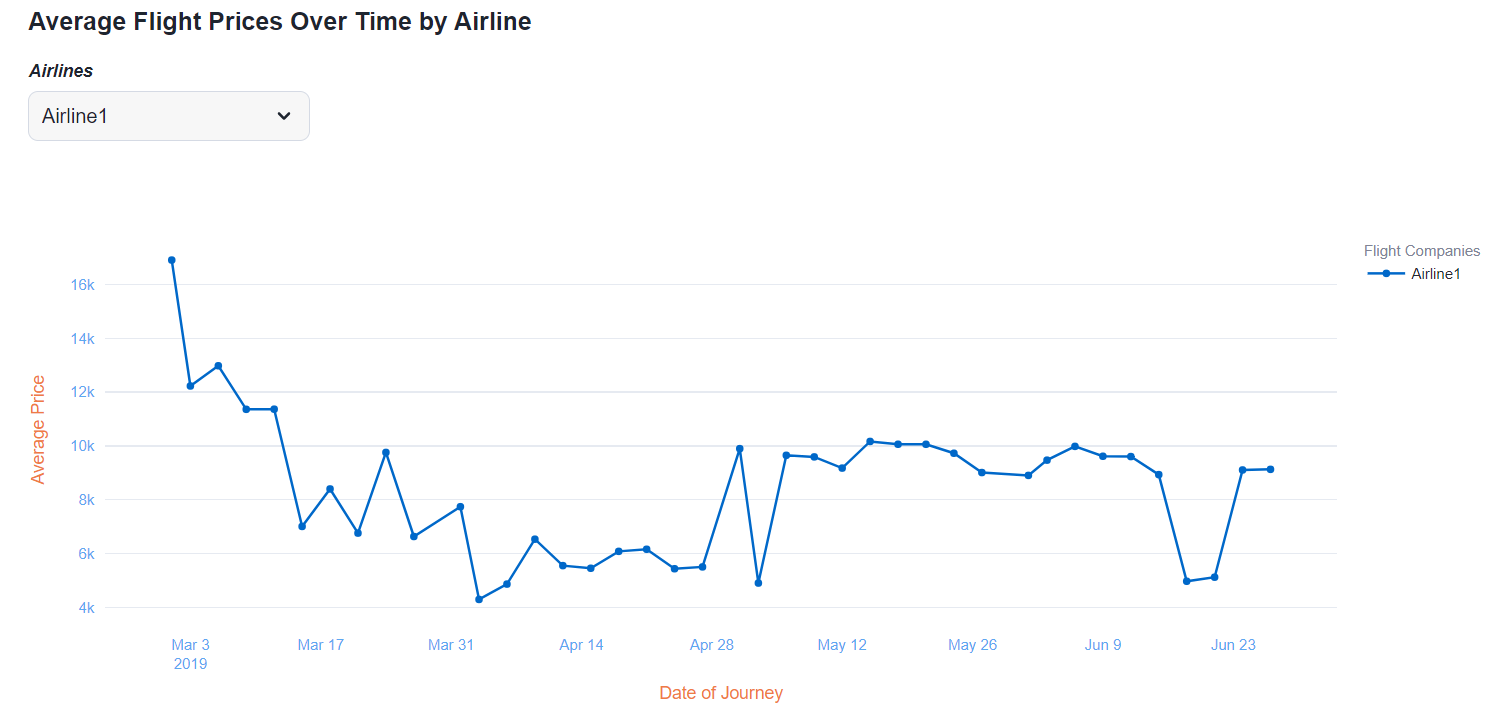
Average Flight Prices Over Time by Airline
We will use a line chart with forecasting capabilities to analyse average flight prices over time for different airlines. Users can filter the data by selecting specific airline companies. This analysis will help us understand pricing trends and predict future prices.
Snowflake Cortex
Snowflake Cortex is an intelligent, fully managed service that offers machine learning and AI solutions to Snowflake users. It brings state of the art ML and AI solutions to your data, within your Snowflake security perimeter.
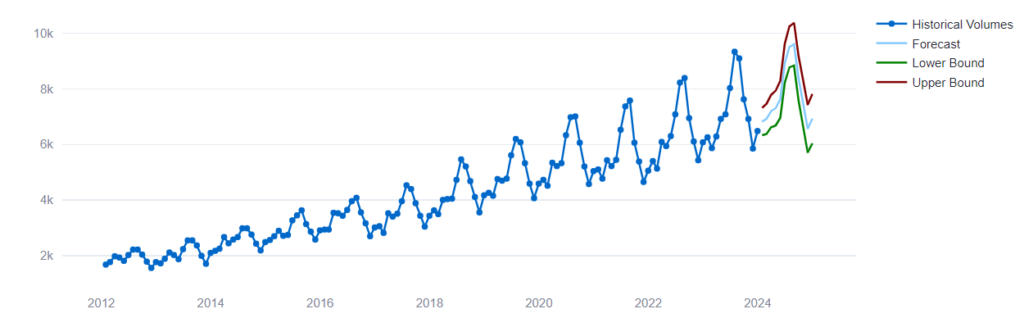
Time Series Forecasting of Passenger Volumes
By analysing passenger data from Airlines, we can forecast future passenger trends using a time series model. A forecast model generates predictions for either a single time series or multiple time series. To create and train the forecasting model, we use the CREATE SNOWFLAKE.ML.FORECAST command. Afterward, we can use the <model_name>!FORECAST method to generate forecasts. This prediction will be visualized in a line chart.
Airline Prediction
Customer Satisfaction Prediction using Snowflake’s Cortex ML Classification Model
Extracting Airline Review Data with Snowflake and Pandas
To create and train the classification model for customer satisfaction prediction, we use the CREATE SNOWFLAKE.ML.CLASSIFICATION command. By collecting the data from the AIRLINE.REVIEW.REVIEW_DATA table and converting it into a DataFrame, we can leverage Pandas’ powerful data manipulation capabilities to gain valuable insights.
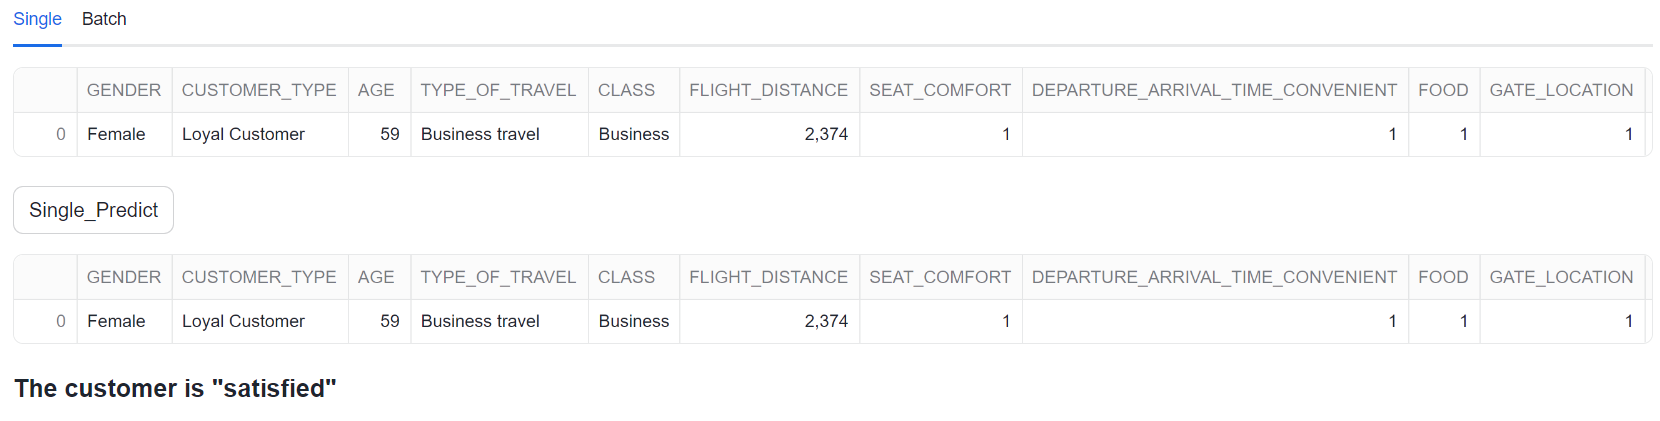
Single Prediction
Upon developing the model, we leverage it to predict a single outcome based on the input features derived from the dataset. By accurately forecasting outcomes, organizations can make informed decisions, optimize operations, and enhance customer satisfaction. For instance, in the context of airline customer satisfaction, the model can help anticipate customer satisfaction levels, enabling better resource allocation and strategic planning.
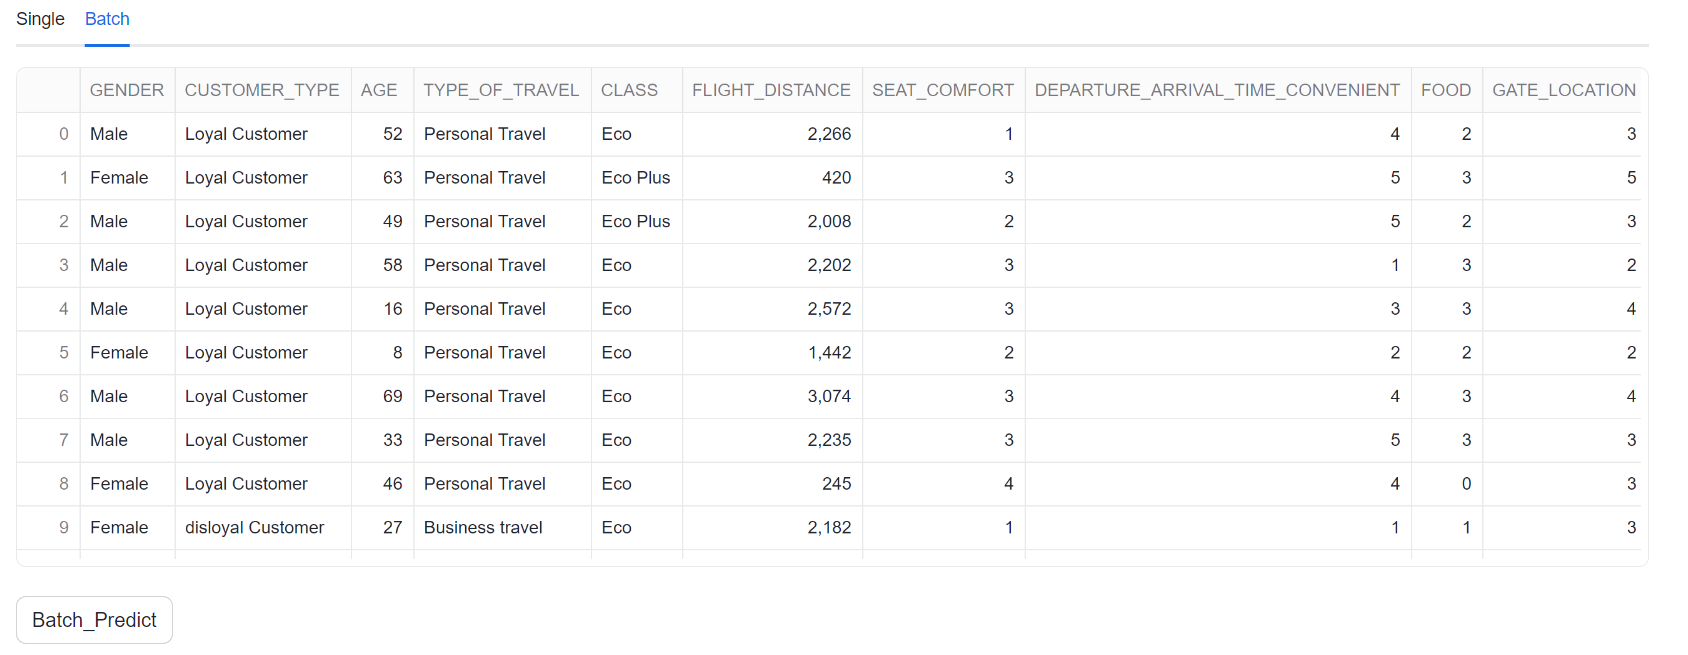
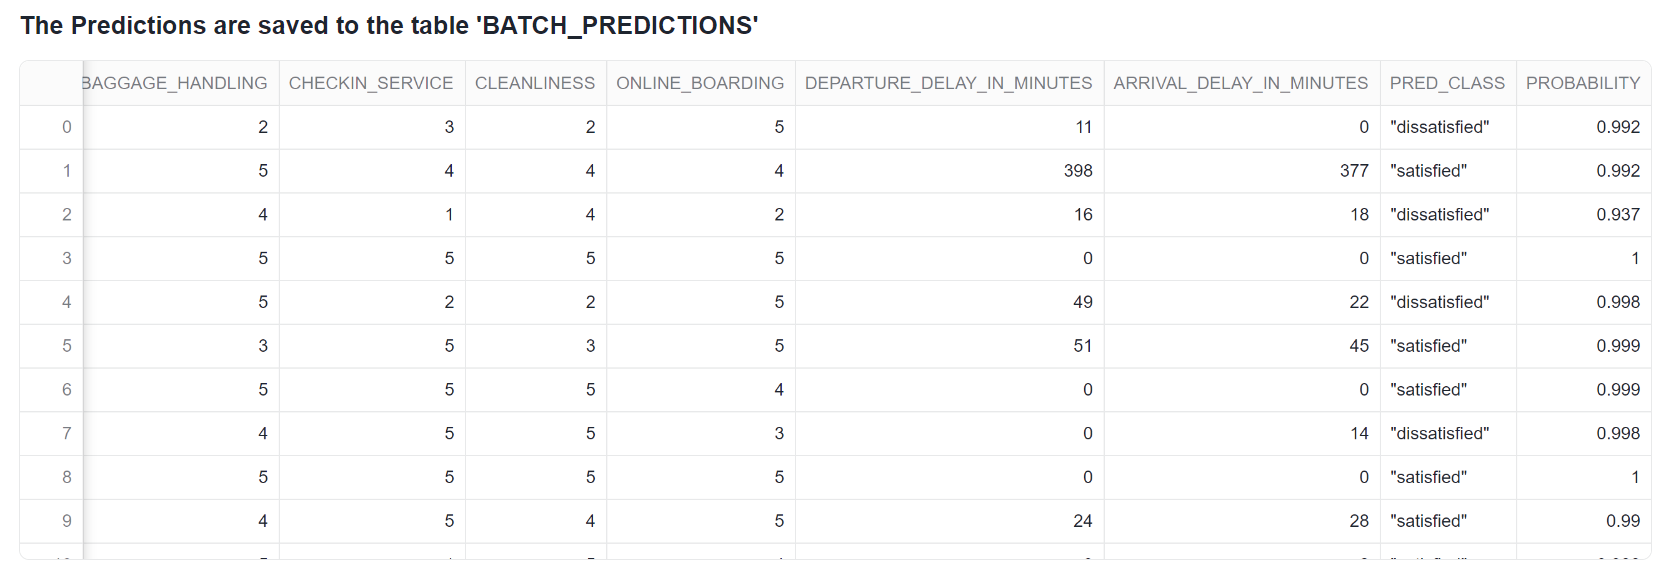
Batch Prediction
The above approach can also be applied to predict outcomes for a batch of records from the dataset, thereby enabling the handling of large volumes of airline review data through batch processing capabilities.
Airline Prices Prediction by using Regression Model
Data Retrieval
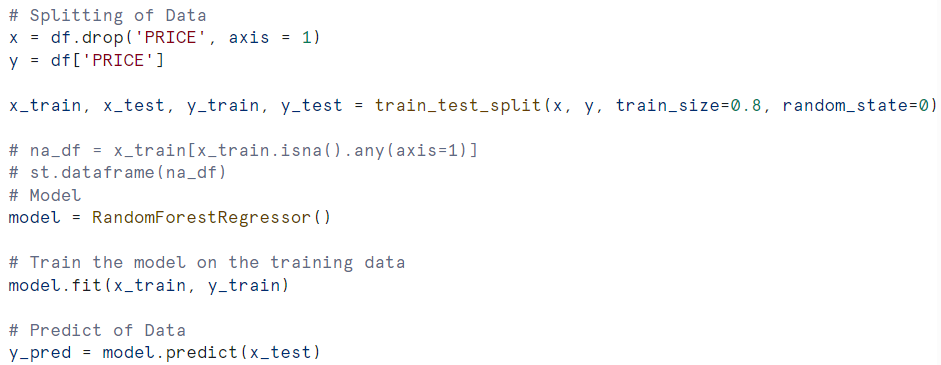
The session begins by retrieving data from the AIRLINE.PRICE.PRICE_DATA table and converting it into a DataFrame. Any rows with missing values are removed to maintain data integrity, ensuring a clean dataset for analysis. To predict airline prices, a regression machine learning model is then created using the RandomForestRegressor() from the sklearn.ensemble library. This model leverages the Random Forest algorithm to provide accurate and reliable price predictions based on the available data.
code:
        session5 = get_active_session()
        result = session5.table("AIRLINE.PRICE.PRICE_DATA")
        list = result.collect()
        df =  pd.DataFrame(list)
Data Preprocessing
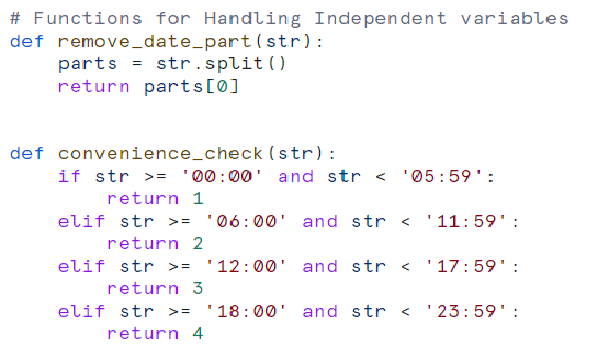
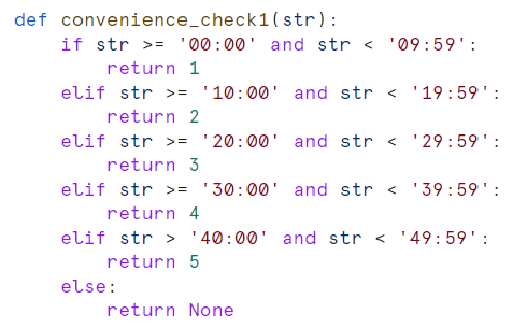
Creating Date Transformation Functions
Transforming the features into categories for easy understanding and to gain insights.
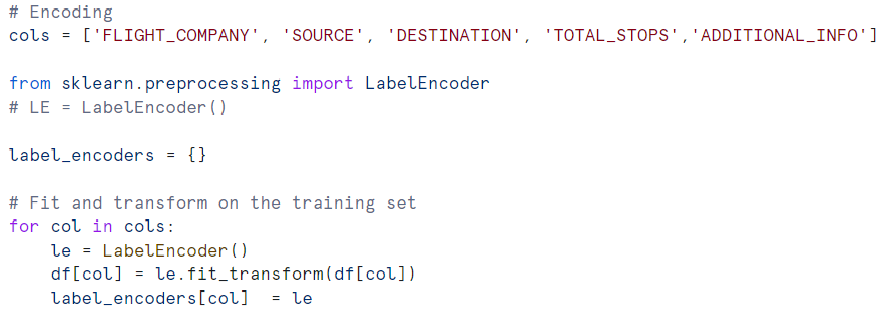
Encoding Categorical Variables
Label encoding is used to convert categorical variables into numeric format, facilitating the modelling process.
Splitting Data and Training the Model
The dataset is split into training and testing sets, and a RandomForestRegressor model is trained on the training data.
Evaluating the Model
The model’s performance is evaluated using R-squared and Adjusted R-squared metrics.

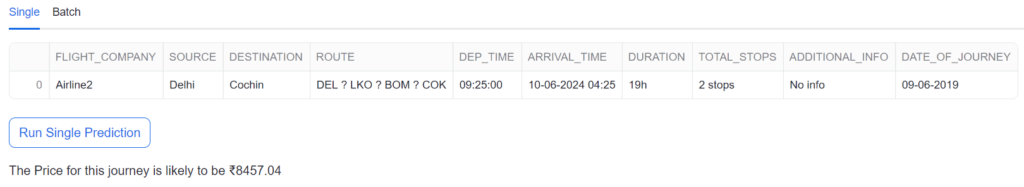
Single Prediction
Upon selecting the single prediction tab, the code retrieves test data, encodes categorical variables, applies preprocessing steps, and subsequently predicts the price for an individual journey.
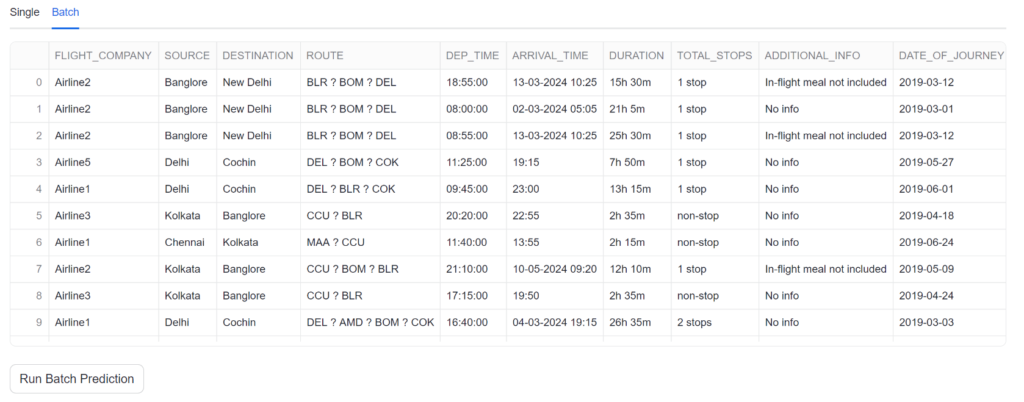
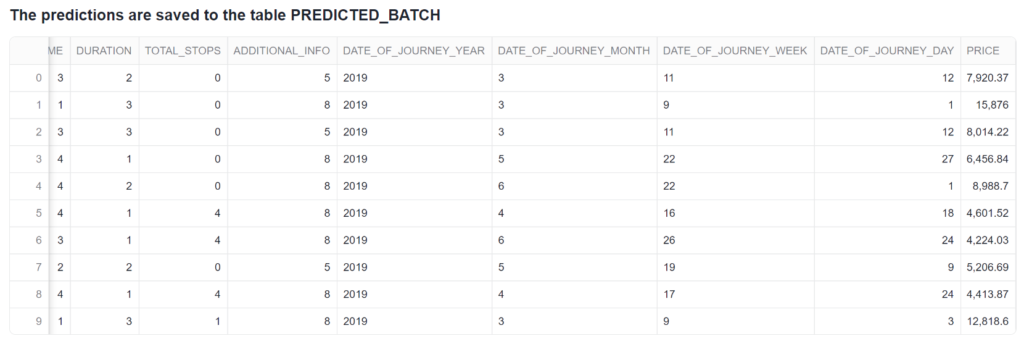
Batch Prediction
Upon selecting the batch prediction tab, the code retrieves test data, encodes categorical variables, applies preprocessing steps, and subsequently predicts the price and stores the results in the PREDICTED_BATCH table, displaying the predictions for review.
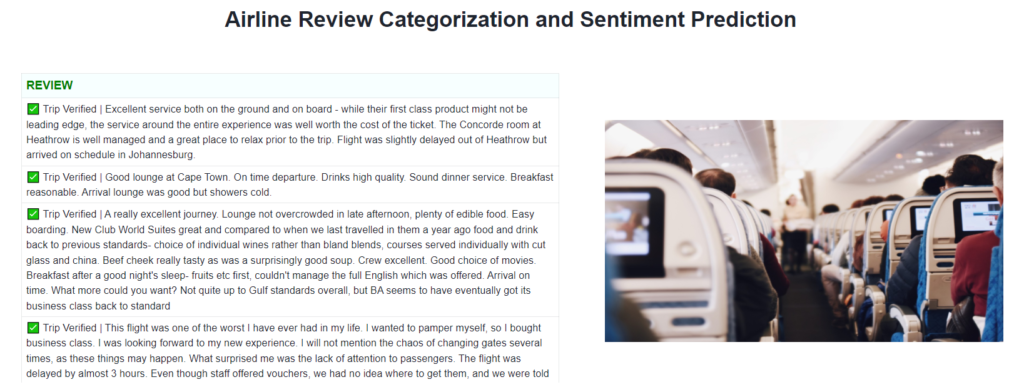
Analysis of Review Sentiment and Categorization using Large Language Models
The primary objective is to categorize customer reviews and determine their sentiment to uncover actionable insights that drive improvements in customer satisfaction. By systematically analyzing feedback, businesses can identify specific areas of focus, allowing for targeted enhancements that elevate the overall customer experience.
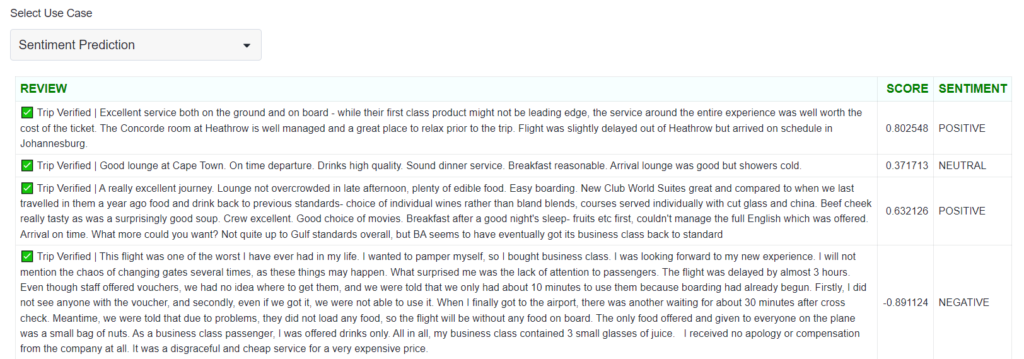
Sentiment Prediction
Sentiment analysis goes beyond categorization by examining the emotional undertones of customer feedback. Using Snowflake’s sentiment function, reviews are evaluated and assigned sentiment scores, which quantify whether the sentiment is positive, neutral, or negative. This scoring mechanism provides businesses with precise data, enabling them to track customer satisfaction trends and respond proactively to concerns, thereby ensuring a more personalized and empathetic approach to customer care.
To achieve these objectives, Snowflake Cortex LLM models and functions are utilized for their powerful ability to process and analyze vast amounts of data with precision. By combining the Snowflake sentiment function with a robust scoring mechanism and leveraging advanced Llama3 LLMs with prompt engineering for review categorization, businesses can automate these tasks efficiently and at scale, continuously improving their customer satisfaction efforts.
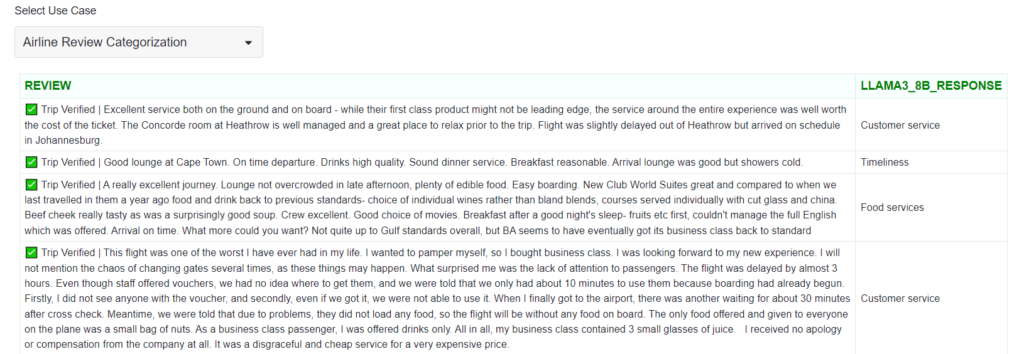
Review Categorization
This process involves sorting and classifying reviews based on the context in which feedback is provided. Llama3 LLMs, coupled with prompt engineering techniques, are leveraged to accurately identify themes and topics central to each review. This allows businesses to gain a deep understanding of recurring issues, strengths, and areas needing attention, leading to more informed decision-making and strategic prioritization.
Conclusion
By analyzing these KPIs, we gain comprehensive insights into airline customer satisfaction and pricing strategies. These visualizations not only help in understanding current trends but also assist in making informed predictions for future planning.
Please feel free to reach out to us for your Snowflake, Streamlit or AI/ML solution needs. Cittabase is a Select Tier partner with Snowflake.